Virtual Reality Market to grow by USD 181,340.96 million from 2022 to 2027; Growth opportunities led by CXR Agency and Firsthand Technology Inc. – Technavio
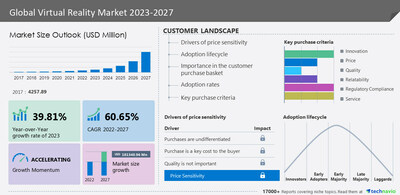
NEW YORK, June 29, 2023 /PRNewswire/ — The latest report on the virtual reality market is estimated to register an incremental growth of USD 181,340.96 million from 2022 to 2027. The market is estimated to register a CAGR of 60.65% during the forecast period The market is fragmented due to the presence of diversified international and regional vendors. The increasing product launches are notably driving virtual reality market growth. Vendors are focusing on developing high-tech AR and VR products, like smart glasses, headsets, and software platforms. To diversify their product lines and expand sales, they are presenting new products. The introduction of multiple new products is expected to drive market expansion. For Instance, in July 2021, a virtual reality stadium called Virtex Stadium was made available, enabling fans to watch games with their friends from the center of the field. The launch overlaps with the advancement in e-sports’ popularity and the improvement in consumer virtual reality hardware’s performance and affordability. Therefore, due to such product launches, the global market is anticipated to grow during the forecast period. The report offers an up-to-date analysis regarding the current market scenario, the latest trends and drivers, and the overall market environment. Request sample report
Virtual Reality Market 2023-2027: Scope
Technavio presents a detailed picture of the market by way of study, synthesis, and summation of data from multiple sources. The soft skills training market report covers the following areas:
- Virtual Reality Market 2023-2027 Size
- Virtual Reality Market 2023-2027 Trends
- Virtual Reality Market 2023-2027 Industry Analysis
Virtual Reality Market 2023-2027: Vendor Analysis
The market is fragmented, and the degree of fragmentation will accelerate during the forecast period. Competitors have to focus on differentiating their product offerings with unique value propositions to strengthen their foothold in the market. Market vendors also have to leverage the existing growth prospects in the fast-growing segments, while maintaining their positions in the slow-growing segments. 360 Labs LLC, Advanced Micro Devices Inc., Alphabet Inc., CXR Agency, Firsthand Technology Inc., Groove Jones LLC, HTC Corp., Innowise Group, KONCEPT VR LLC, Manus Technologies Group B.V., Marxent Labs LLC, Meta Platforms Inc., Microsoft Corp., NVIDIA Corp., Retinad, The Ninehertz, Unity Software Inc., Virtalis Holdings Ltd., Wevr, and WorldViz Inc. are among some of the major market participants.
Vendor Offerings
- CXR Agency – The company offers virtual reality such as VR headsets and glasses.
- Firsthand Technology Inc. – The company offers virtual reality such as Vive VR headset.
- Alphabet Inc. – The company offers virtual reality such as Youtube VR and Earth VR.
What`s New for 2023?
- Special coverage on the Russia-Ukraine war; global inflation; recovery analysis from COVID-19; supply chain disruptions, global trade tensions; and risk of recession
- Global competitiveness and key competitor positions
- Market presence across multiple geographical footprints – Strong/Active/Niche/Trivial
- Customization options available as per your business needs
- Access to 17000+ research report subscriptions – buy now!
Virtual Reality Market 2023-2027: Market Dynamics
Key Trends
The introduction of 360-degree videos is a major trend in the virtual reality market. The advancements in 360-degree cameras have significantly accelerated the transition from static 2D virtual images to real-time 360-degree virtual videos. The students can take high-resolution photos or videos of their field trips thanks to the 360-degree cameras. Additionally, these videos can be used to create virtual reality content, which can then be turned into digital simulations. However, educators can create virtual reality course content by utilizing more user-friendly features like live streaming and video stitching brought about by recent advancements in 360-degree cameras. In addition, live-streaming content in 2K resolution while simultaneously editing and sharing content is possible with the camera. The production and design of high-quality virtual reality content is becoming increasingly dependent on the ever-evolving 360-degree cameras. As a result, it is anticipated that the global market will gain importance over the forecast period.
Significant Challenges
The requirement for high-speed Internet and computation power is the significant challenge hindering the virtual reality market growth. Problems with the integration of processes and infrastructure are the primary obstacle preventing the market from expanding. For effective implementation, virtual reality solutions should have access to high-speed, high-bandwidth internet. System downtime and decreased productivity in the workplace can result from any issue, including a slow network, insufficient electricity, or connectivity issues. This is a significant obstacle to the successful implementation of advanced systems by various businesses, particularly in developing nations. The various configurations of virtual reality technologies exacerbate a highly heterogeneous information technology environment. These integration glitches are expected to cause interoperability issues for customers. Furthermore, new interoperability issues are brought about by any upgrades to virtual reality systems. As a result, augmented and virtual reality cannot be used in healthcare due to a number of infrastructure and system integration issues. As a result, the demand for fast internet will stifle the market’s expansion during the forecast period.
Virtual Reality Market 2023-2027: Segmentation
Virtual Reality Market is segmented as below:
- Component
- Hardware
- Software
- End-user
- Enterprise
- Consumer
- Geography
- North America
- APAC
- Europe
- Middle East And Africa
- South America
The VR market share growth by the hardware segment will be significant during the forecast period. Virtual reality technology is being used by educators in more academic fields to provide higher-quality instruction. For instance, students now have the chance to fully engage themselves in the world of virtual reality technology thanks to the introduction of virtual reality in education. The use of technology also facilitates educators to provide less expensive lessons to students that are more visually attractive and interesting. Virtual reality hardware is also being used more often in the gaming sector. For instance, in order to give customers a high-quality virtual reality experience that permits users to engage themselves in the gaming world with a variety of experiences. Therefore, due to these factors, the hardware segment of the global market is anticipated to increase during the forecast period.
For insights on global, regional, and country-level parameters with growth opportunities, historic (2017 to 2021) & forecast (2023-2027) – Download a Sample Report
Virtual Reality Market 2023-2027: Key Highlights
- CAGR of the market during the forecast period 2023-2027
- Detailed information on factors that will assist virtual reality market growth during the next five years
- Estimation of the virtual reality market size and its contribution to the parent market
- Predictions on upcoming trends and changes in consumer behavior
- The growth of the virtual reality market
- Analysis of the market’s competitive landscape and detailed information on vendors
- Comprehensive details of factors that will challenge the growth of the virtual reality market vendors
Gain instant access to 17,000+ market research reports.
Technavio’s SUBSCRIPTION platform
Related Reports:
The Virtual Reality (VR) Market in Healthcare market size is estimated to grow at a CAGR of 32.85% between 2022 and 2027. The market size is forecast to increase by USD 9,019.06 million. This report extensively covers market segmentation by component (software and services), end-user (research and diagnostics, hospitals and clinics, and others), and geography (North America, Europe, APAC, South America, and the Middle East and Africa). Growing demand for healthcare services is notably driving Virtual Reality (VR) in the Healthcare Market growth.
The virtual reality market share in the education sector is expected to increase by USD 16.12 billion from 2021 to 2026, and the market’s growth momentum will accelerate at a CAGR of 59.28%. This report extensively covers virtual reality market segmentation in the education sector by product (VR hardware and VR content), end-user (higher education and K-12), and geography (North America, Europe, APAC, South America, and the Middle East and Africa). One of the key factors driving growth in the virtual reality market in the education sector is the increased affordability of VR gear.
|
Virtual Reality Market Scope |
|
|
Report Coverage |
Details |
|
Base year |
2022 |
|
Historic period |
2017-2021 |
|
Forecast period |
2023-2027 |
|
Growth momentum & CAGR |
Accelerate at a CAGR of 60.65% |
|
Market growth 2023-2027 |
USD 181,340.96 million |
|
Market structure |
Fragmented |
|
YoY growth 2022-2023(%) |
39.81 |
|
Regional analysis |
North America, APAC, Europe, Middle East and Africa, and South America |
|
Performing market contribution |
North America at 35% |
|
Key countries |
US, China, Japan, Germany, and the UK |
|
Competitive landscape |
Leading Vendors, Market Positioning of Vendors, Competitive Strategies, and Industry Risks |
|
Key companies profiled |
360 Labs LLC, Advanced Micro Devices Inc., Alphabet Inc., CXR Agency, Firsthand Technology Inc., Groove Jones LLC, HTC Corp., Innowise Group, KONCEPT VR LLC, Manus Technologies Group B.V., Marxent Labs LLC, Meta Platforms Inc., Microsoft Corp., NVIDIA Corp., Retinad, The Ninehertz, Unity Software Inc., Virtalis Holdings Ltd., Wevr, and WorldViz Inc. |
|
Market dynamics |
Parent market analysis, Market growth inducers and obstacles, Fast-growing and slow-growing segment analysis, COVID-19 impact and recovery analysis and future consumer dynamics, Market condition analysis for the forecast period. |
|
Customization purview |
If our report has not included the data that you are looking for, you can reach out to our analysts and get segments customized. |
|
Customization purview |
If our report has not included the data that you are looking for, you can reach out to our analysts and get segments customized. |
Table of contents
1 Executive Summary
- 1.1 Market overview
- Exhibit 01: Executive Summary – Chart on Market Overview
- Exhibit 02: Executive Summary – Data Table on Market Overview
- Exhibit 03: Executive Summary – Chart on Global Market Characteristics
- Exhibit 04: Executive Summary – Chart on Market by Geography
- Exhibit 05: Executive Summary – Chart on Market Segmentation by Component
- Exhibit 06: Executive Summary – Chart on Market Segmentation by End-user
- Exhibit 07: Executive Summary – Chart on Incremental Growth
- Exhibit 08: Executive Summary – Data Table on Incremental Growth
- Exhibit 09: Executive Summary – Chart on Vendor Market Positioning
2 Market Landscape
- 2.1 Market ecosystem
- Exhibit 10: Parent market
- Exhibit 11: Market Characteristics
3 Market Sizing
- 3.1 Market definition
- Exhibit 12: Offerings of vendors included in the market definition
- 3.2 Market segment analysis
- Exhibit 13: Market segments
- 3.3 Market size 2022
- 3.4 Market outlook: Forecast for 2022-2027
- Exhibit 14: Chart on Global – Market size and forecast 2022-2027 ($ million)
- Exhibit 15: Data Table on Global – Market size and forecast 2022-2027 ($ million)
- Exhibit 16: Chart on Global Market: Year-over-year growth 2022-2027 (%)
- Exhibit 17: Data Table on Global Market: Year-over-year growth 2022-2027 (%)
4 Historic Market Size
- 4.1 Global virtual reality market 2017 – 2021
- Exhibit 18: Historic Market Size – Data Table on Global virtual reality market 2017 – 2021 ($ million)
- 4.2 Component Segment Analysis 2017 – 2021
- Exhibit 19: Historic Market Size – Component Segment 2017 – 2021 ($ million)
- 4.3 End-User Segment Analysis 2017 – 2021
- Exhibit 20: Historic Market Size – End-User Segment 2017 – 2021 ($ million)
- 4.4 Geography Segment Analysis 2017 – 2021
- Exhibit 21: Historic Market Size – Geography Segment 2017 – 2021 ($ million)
- 4.5 Country Segment Analysis 2017 – 2021
- Exhibit 22: Historic Market Size – Country Segment 2017 – 2021 ($ million)
5 Five Forces Analysis
- 5.1 Five forces summary
- Exhibit 23: Five forces analysis – Comparison between 2022 and 2027
- 5.2 Bargaining power of buyers
- Exhibit 24: Chart on Bargaining power of buyers – Impact of key factors 2022 and 2027
- 5.3 Bargaining power of suppliers
- Exhibit 25: Bargaining power of suppliers – Impact of key factors in 2022 and 2027
- 5.4 Threat of new entrants
- Exhibit 26: Threat of new entrants – Impact of key factors in 2022 and 2027
- 5.5 Threat of substitutes
- Exhibit 27: Threat of substitutes – Impact of key factors in 2022 and 2027
- 5.6 Threat of rivalry
- Exhibit 28: Threat of rivalry – Impact of key factors in 2022 and 2027
- 5.7 Market condition
- Exhibit 29: Chart on Market condition – Five forces 2022 and 2027
6 Market Segmentation by Component
- 6.1 Market segments
- Exhibit 30: Chart on Component – Market share 2022-2027 (%)
- Exhibit 31: Data Table on Component – Market share 2022-2027 (%)
- 6.2 Comparison by Component
- Exhibit 32: Chart on Comparison by Component
- Exhibit 33: Data Table on Comparison by Component
- 6.3 Hardware – Market size and forecast 2022-2027
- Exhibit 34: Chart on Hardware – Market size and forecast 2022-2027 ($ million)
- Exhibit 35: Data Table on Hardware – Market size and forecast 2022-2027 ($ million)
- Exhibit 36: Chart on Hardware – Year-over-year growth 2022-2027 (%)
- Exhibit 37: Data Table on Hardware – Year-over-year growth 2022-2027 (%)
- 6.4 Software – Market size and forecast 2022-2027
- Exhibit 38: Chart on Software – Market size and forecast 2022-2027 ($ million)
- Exhibit 39: Data Table on Software – Market size and forecast 2022-2027 ($ million)
- Exhibit 40: Chart on Software – Year-over-year growth 2022-2027 (%)
- Exhibit 41: Data Table on Software – Year-over-year growth 2022-2027 (%)
- 6.5 Market opportunity by Component
- Exhibit 42: Market opportunity by Component ($ million)
- Exhibit 43: Data Table on Market opportunity by Component ($ million)
7 Market Segmentation by End-user
- 7.1 Market segments
- Exhibit 44: Chart on End-user – Market share 2022-2027 (%)
- Exhibit 45: Data Table on End-user – Market share 2022-2027 (%)
- 7.2 Comparison by End-user
- Exhibit 46: Chart on Comparison by End-user
- Exhibit 47: Data Table on Comparison by End-user
- 7.3 Enterprise – Market size and forecast 2022-2027
- Exhibit 48: Chart on Enterprise – Market size and forecast 2022-2027 ($ million)
- Exhibit 49: Data Table on Enterprise – Market size and forecast 2022-2027 ($ million)
- Exhibit 50: Chart on Enterprise – Year-over-year growth 2022-2027 (%)
- Exhibit 51: Data Table on Enterprise – Year-over-year growth 2022-2027 (%)
- 7.4 Consumer – Market size and forecast 2022-2027
- Exhibit 52: Chart on Consumer – Market size and forecast 2022-2027 ($ million)
- Exhibit 53: Data Table on Consumer – Market size and forecast 2022-2027 ($ million)
- Exhibit 54: Chart on Consumer – Year-over-year growth 2022-2027 (%)
- Exhibit 55: Data Table on Consumer – Year-over-year growth 2022-2027 (%)
- 7.5 Market opportunity by End-user
- Exhibit 56: Market opportunity by End-user ($ million)
- Exhibit 57: Data Table on Market opportunity by End-user ($ million)
8 Customer Landscape
- 8.1 Customer landscape overview
- Exhibit 58: Analysis of price sensitivity, lifecycle, customer purchase basket, adoption rates, and purchase criteria
9 Geographic Landscape
- 9.1 Geographic segmentation
- Exhibit 59: Chart on Market share by geography 2022-2027 (%)
- Exhibit 60: Data Table on Market share by geography 2022-2027 (%)
- 9.2 Geographic comparison
- Exhibit 61: Chart on Geographic comparison
- Exhibit 62: Data Table on Geographic comparison
- 9.3 North America – Market size and forecast 2022-2027
- Exhibit 63: Chart on North America – Market size and forecast 2022-2027 ($ million)
- Exhibit 64: Data Table on North America – Market size and forecast 2022-2027 ($ million)
- Exhibit 65: Chart on North America – Year-over-year growth 2022-2027 (%)
- Exhibit 66: Data Table on North America – Year-over-year growth 2022-2027 (%)
- 9.4 APAC – Market size and forecast 2022-2027
- Exhibit 67: Chart on APAC – Market size and forecast 2022-2027 ($ million)
- Exhibit 68: Data Table on APAC – Market size and forecast 2022-2027 ($ million)
- Exhibit 69: Chart on APAC – Year-over-year growth 2022-2027 (%)
- Exhibit 70: Data Table on APAC – Year-over-year growth 2022-2027 (%)
- 9.5 Europe – Market size and forecast 2022-2027
- Exhibit 71: Chart on Europe – Market size and forecast 2022-2027 ($ million)
- Exhibit 72: Data Table on Europe – Market size and forecast 2022-2027 ($ million)
- Exhibit 73: Chart on Europe – Year-over-year growth 2022-2027 (%)
- Exhibit 74: Data Table on Europe – Year-over-year growth 2022-2027 (%)
- 9.6 Middle East and Africa – Market size and forecast 2022-2027
- Exhibit 75: Chart on Middle East and Africa – Market size and forecast 2022-2027 ($ million)
- Exhibit 76: Data Table on Middle East and Africa – Market size and forecast 2022-2027 ($ million)
- Exhibit 77: Chart on Middle East and Africa – Year-over-year growth 2022-2027 (%)
- Exhibit 78: Data Table on Middle East and Africa – Year-over-year growth 2022-2027 (%)
- 9.7 South America – Market size and forecast 2022-2027
- Exhibit 79: Chart on South America – Market size and forecast 2022-2027 ($ million)
- Exhibit 80: Data Table on South America – Market size and forecast 2022-2027 ($ million)
- Exhibit 81: Chart on South America – Year-over-year growth 2022-2027 (%)
- Exhibit 82: Data Table on South America – Year-over-year growth 2022-2027 (%)
- 9.8 US – Market size and forecast 2022-2027
- Exhibit 83: Chart on US – Market size and forecast 2022-2027 ($ million)
- Exhibit 84: Data Table on US – Market size and forecast 2022-2027 ($ million)
- Exhibit 85: Chart on US – Year-over-year growth 2022-2027 (%)
- Exhibit 86: Data Table on US – Year-over-year growth 2022-2027 (%)
- 9.9 China – Market size and forecast 2022-2027
- Exhibit 87: Chart on China – Market size and forecast 2022-2027 ($ million)
- Exhibit 88: Data Table on China – Market size and forecast 2022-2027 ($ million)
- Exhibit 89: Chart on China – Year-over-year growth 2022-2027 (%)
- Exhibit 90: Data Table on China – Year-over-year growth 2022-2027 (%)
- 9.10 Germany – Market size and forecast 2022-2027
- Exhibit 91: Chart on Germany – Market size and forecast 2022-2027 ($ million)
- Exhibit 92: Data Table on Germany – Market size and forecast 2022-2027 ($ million)
- Exhibit 93: Chart on Germany – Year-over-year growth 2022-2027 (%)
- Exhibit 94: Data Table on Germany – Year-over-year growth 2022-2027 (%)
- 9.11 UK – Market size and forecast 2022-2027
- Exhibit 95: Chart on UK – Market size and forecast 2022-2027 ($ million)
- Exhibit 96: Data Table on UK – Market size and forecast 2022-2027 ($ million)
- Exhibit 97: Chart on UK – Year-over-year growth 2022-2027 (%)
- Exhibit 98: Data Table on UK – Year-over-year growth 2022-2027 (%)
- 9.12 Japan – Market size and forecast 2022-2027
- Exhibit 99: Chart on Japan – Market size and forecast 2022-2027 ($ million)
- Exhibit 100: Data Table on Japan – Market size and forecast 2022-2027 ($ million)
- Exhibit 101: Chart on Japan – Year-over-year growth 2022-2027 (%)
- Exhibit 102: Data Table on Japan – Year-over-year growth 2022-2027 (%)
- 9.13 Market opportunity by geography
- Exhibit 103: Market opportunity by geography ($ million)
- Exhibit 104: Data Tables on Market opportunity by geography ($ million)
10 Drivers, Challenges, and Trends
- 10.1 Market drivers
- 10.2 Market challenges
- 10.3 Impact of drivers and challenges
- Exhibit 105: Impact of drivers and challenges in 2022 and 2027
- 10.4 Market trends
11 Vendor Landscape
- 11.1 Overview
- 11.2 Vendor landscape
- Exhibit 106: Overview on Criticality of inputs and Factors of differentiation
- 11.3 Landscape disruption
- Exhibit 107: Overview on factors of disruption
- 11.4 Industry risks
- Exhibit 108: Impact of key risks on business
12 Vendor Analysis
- 12.1 Vendors covered
- Exhibit 109: Vendors covered
- 12.2 Market positioning of vendors
- Exhibit 110: Matrix on vendor position and classification
- 12.3 Alphabet Inc.
- Exhibit 111: Alphabet Inc. – Overview
- Exhibit 112: Alphabet Inc. – Business segments
- Exhibit 113: Alphabet Inc. – Key news
- Exhibit 114: Alphabet Inc. – Key offerings
- Exhibit 115: Alphabet Inc. – Segment focus
- 12.4 CXR Agency
- Exhibit 116: CXR Agency – Overview
- Exhibit 117: CXR Agency – Product / Service
- Exhibit 118: CXR Agency – Key offerings
- 12.5 Firsthand Technology Inc.
- Exhibit 119: Firsthand Technology Inc. – Overview
- Exhibit 120: Firsthand Technology Inc. – Product / Service
- Exhibit 121: Firsthand Technology Inc. – Key offerings
- 12.6 HTC Corp.
- Exhibit 122: HTC Corp. – Overview
- Exhibit 123: HTC Corp. – Product / Service
- Exhibit 124: HTC Corp. – Key offerings
- 12.7 Innowise Group
- Exhibit 125: Innowise Group – Overview
- Exhibit 126: Innowise Group – Product / Service
- Exhibit 127: Innowise Group – Key offerings
- 12.8 KONCEPT VR LLC
- Exhibit 128: KONCEPT VR LLC – Overview
- Exhibit 129: KONCEPT VR LLC – Product / Service
- Exhibit 130: KONCEPT VR LLC – Key offerings
- 12.9 Meta Platforms Inc.
- Exhibit 131: Meta Platforms Inc. – Overview
- Exhibit 132: Meta Platforms Inc. – Business segments
- Exhibit 133: Meta Platforms Inc. – Key news
- Exhibit 134: Meta Platforms Inc. – Key offerings
- Exhibit 135: Meta Platforms Inc. – Segment focus
- 12.10 Microsoft Corp.
- Exhibit 136: Microsoft Corp. – Overview
- Exhibit 137: Microsoft Corp. – Business segments
- Exhibit 138: Microsoft Corp. – Key news
- Exhibit 139: Microsoft Corp. – Key offerings
- Exhibit 140: Microsoft Corp. – Segment focus
- 12.11 NVIDIA Corp.
- Exhibit 141: NVIDIA Corp. – Overview
- Exhibit 142: NVIDIA Corp. – Business segments
- Exhibit 143: NVIDIA Corp. – Key news
- Exhibit 144: NVIDIA Corp. – Key offerings
- Exhibit 145: NVIDIA Corp. – Segment focus
- 12.12 Retinad
- Exhibit 146: Retinad – Overview
- Exhibit 147: Retinad – Product / Service
- Exhibit 148: Retinad – Key offerings
- 12.13 The Ninehertz
- Exhibit 149: The Ninehertz – Overview
- Exhibit 150: The Ninehertz – Product / Service
- Exhibit 151: The Ninehertz – Key offerings
- 12.14 Unity Software Inc.
- Exhibit 152: Unity Software Inc. – Overview
- Exhibit 153: Unity Software Inc. – Product / Service
- Exhibit 154: Unity Software Inc. – Key offerings
- 12.15 Virtalis Holdings Ltd.
- Exhibit 155: Virtalis Holdings Ltd. – Overview
- Exhibit 156: Virtalis Holdings Ltd. – Product / Service
- Exhibit 157: Virtalis Holdings Ltd. – Key offerings
- 12.16 Wevr
- Exhibit 158: Wevr – Overview
- Exhibit 159: Wevr – Product / Service
- Exhibit 160: Wevr – Key offerings
- 12.17 WorldViz Inc.
- Exhibit 161: WorldViz Inc. – Overview
- Exhibit 162: WorldViz Inc. – Product / Service
- Exhibit 163: WorldViz Inc. – Key offerings
13 Appendix
- 13.1 Scope of the report
- 13.2 Inclusions and exclusions checklist
- Exhibit 164: Inclusions checklist
- Exhibit 165: Exclusions checklist
- 13.3 Currency conversion rates for US$
- Exhibit 166: Currency conversion rates for US$
- 13.4 Research methodology
- Exhibit 167: Research methodology
- Exhibit 168: Validation techniques employed for market sizing
- Exhibit 169: Information sources
- 13.5 List of abbreviations
- Exhibit 170: List of abbreviations
About Us
Technavio is a leading global technology research and advisory company. Their research and analysis focus on emerging market trends and provide actionable insights to help businesses identify market opportunities and develop effective strategies to optimize their market positions. With over 500 specialized analysts, Technavio’s report library consists of more than 17,000 reports and counting, covering 800 technologies, spanning 50 countries. Their client base consists of enterprises of all sizes, including more than 100 Fortune 500 companies. This growing client base relies on Technavio’s comprehensive coverage, extensive research, and actionable market insights to identify opportunities in existing and potential markets and assess their competitive positions within changing market scenarios.
Contact
Technavio Research
Jesse Maida
Media & Marketing Executive
US: +1 844 364 1100
UK: +44 203 893 3200
Email: media@technavio.com
Website: www.technavio.com
![]()
![]() View original content to download multimedia:https://www.prnewswire.com/news-releases/virtual-reality-market-to-grow-by-usd-181-340-96-million-from-2022-to-2027-growth-opportunities-led-by-cxr-agency-and-firsthand-technology-inc—technavio-301865592.html
View original content to download multimedia:https://www.prnewswire.com/news-releases/virtual-reality-market-to-grow-by-usd-181-340-96-million-from-2022-to-2027-growth-opportunities-led-by-cxr-agency-and-firsthand-technology-inc—technavio-301865592.html
SOURCE Technavio
