Metaverse Market Size to Grow by USD 677.98 billion | Accenture Plc and ByteDance Ltd. Among Key Vendors | Technavio
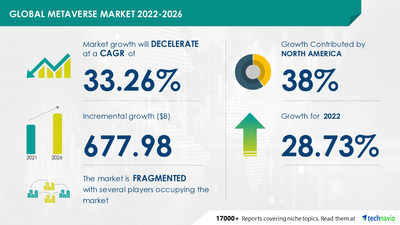
NEW YORK, May 11, 2022 /PRNewswire/ — The metaverse market will be led by North America. The region will account for 38% of the market’s growth during the forecast period. The market size is expected to grow by USD 677.98 billion from 2021 to 2026. However, the growth momentum of the market will decelerate at a CAGR of 33.26% during the forecast period, according to Technavio. The report offers an up-to-date analysis as well as exact growth variance and the Y-O-Y growth rate.
Request an Exclusive Sample Report to learn about additional dynamics of the metaverse market.
Metaverse Market 2022-2026: Scope
The metaverse market report covers the following areas:
Metaverse Market 2022-2026: Segmentation
- Device
- VR And AR Devices: The VR and AR devices segment will have significant market share growth during the forecast period. Factors such as new product launches and growing adoption of VR/AR in different application areas, including metaverse, are expected to drive the growth of this segment.
- Computing Devices
- Geography
- North America: North America will account for the highest market share growth during the forecast period. The rising adoption of technologically advanced applications among consumers will drive the metaverse market growth in North America during the forecast period.
- Europe
- APAC
- South America
- Middle East And Africa
Learn more about the contribution of each segment of the metaverse market. Download a Sample Report
Metaverse Market 2022-2026: Vendor Analysis
We provide a detailed analysis of around 25 vendors operating in the metaverse market, including Accenture Plc, Active Theory LLC, Animoca Brands Corp. Ltd, ByteDance Ltd., Decentraland Foundation, Devden Creative Solutions Pvt. Ltd, Epic Games Inc., GoMeta Inc., Infosys Ltd., Magic Leap Inc., Meta Platforms Inc., Microsoft Corp., Mobiloitte Technologies, NexTech AR Solutions Corp., NVIDIA Corp., Queppelin, Roblox Corp, Tencent Holdings Ltd., Unity Software Inc., and Wilkins Avenue AR among others. The key offerings of some of these vendors are listed below:
- Accenture Plc – The company offers metaverse, namely Metaverse Continuum.
- ByteDance Ltd. – The company offers metaverse, namely Paiduidao.
- Devden Creative Solutions Pvt. Ltd – The company offers metaverse for aerospace and defense, healthcare, eLearning, real estate, and interior design and design agency.
- Infosys Ltd. – The company offers metaverse, namely Infosys Metaverse, to accelerate and enhance enterprise virtual physical interconnection.
- Meta Platforms Inc. – The company offers metaverse with 3D virtual reality and augmented reality with Meta Quest.
Get lifetime access to our Technavio Insights! Subscribe to our “Basic Plan” billed annually at USD 5000.
Metaverse Market 2022-2026: Key Highlights
- CAGR of the market during the forecast period 2022-2026
- Detailed information on factors that will assist metaverse market growth during the next five years
- Estimation of the metaverse market size and its contribution to the parent market
- Predictions on upcoming trends and changes in consumer behavior
- The growth of the metaverse market
- Analysis of the market’s competitive landscape and detailed information on vendors
- Comprehensive details of factors that will challenge the growth of metaverse market vendors
Related Reports:
Non-fungible Token (NFT) Market by Application and Geography – Forecast and Analysis 2022-2026
Metaverse Real Estate Market by End-user and Geography – Forecast and Analysis 2022-2026
|
Metaverse Market Scope |
|
|
Report Coverage |
Details |
|
Page number |
120 |
|
Base year |
2021 |
|
Forecast period |
2022-2026 |
|
Growth momentum & CAGR |
Decelerate at a CAGR of 33.26% |
|
Market growth 2022-2026 |
USD 677.98 billion |
|
Market structure |
Fragmented |
|
YoY growth (%) |
28.73 |
|
Regional analysis |
North America, Europe, APAC, South America, and Middle East and Africa |
|
Performing market contribution |
North America at 38% |
|
Key consumer countries |
US, Canada, China, Germany, and UK |
|
Competitive landscape |
Leading companies, competitive strategies, consumer engagement scope |
|
Companies profiled |
Accenture Plc, Active Theory LLC, Animoca Brands Corp. Ltd, ByteDance Ltd., Decentraland Foundation, Devden Creative Solutions Pvt. Ltd, Epic Games Inc., GoMeta Inc., Infosys Ltd., Magic Leap Inc., Meta Platforms Inc., Microsoft Corp., Mobiloitte Technologies, NexTech AR Solutions Corp., NVIDIA Corp., Queppelin, Roblox Corp, Tencent Holdings Ltd., Unity Software Inc., and Wilkins Avenue AR |
|
Market Dynamics |
Parent market analysis, Market growth inducers and obstacles, Fast-growing and slow-growing segment analysis, COVID 19 impact and future consumer dynamics, market condition analysis for the forecast period, |
|
Customization purview |
If our report has not included the data that you are looking for, you can reach out to our analysts and get segments customized. |
Table Of Contents :
1 Executive Summary
- 1.1 Market overview
- Exhibit 01: Executive Summary – Chart on Market Overview
- Exhibit 02: Executive Summary – Data Table on Market Overview
- Exhibit 03: Executive Summary – Chart on Global Market Characteristics
- Exhibit 04: Executive Summary – Chart on Market by Geography
- Exhibit 05: Executive Summary – Chart on Market Segmentation by Device
- Exhibit 06: Executive Summary – Chart on Incremental Growth
- Exhibit 07: Executive Summary – Data Table on Incremental Growth
- Exhibit 08: Executive Summary – Chart on Vendor Market Positioning
2 Market Landscape
- 2.1 Market ecosystem
- Exhibit 09: Parent market
- Exhibit 10: Market Characteristics
3 Market Sizing
- 3.1 Market definition
- Exhibit 11: Offerings of vendors included in the market definition
- 3.2 Market segment analysis
- Exhibit 12: Market segments
- 3.3 Market size 2021
- 3.4 Market outlook: Forecast for 2021-2026
- Exhibit 13: Chart on Global – Market size and forecast 2021-2026 ($ billion)
- Exhibit 14: Data Table on Global – Market size and forecast 2021-2026 ($ billion)
- Exhibit 15: Chart on Global Market: Year-over-year growth 2021-2026 (%)
- Exhibit 16: Data Table on Global Market: Year-over-year growth 2021-2026 (%)
4 Five Forces Analysis
- 4.1 Five forces summary
- Exhibit 17: Five forces analysis – Comparison between2021 and 2026
- 4.2 Bargaining power of buyers
- Exhibit 18: Chart on Bargaining power of buyers – Impact of key factors 2021 and 2026
- 4.3 Bargaining power of suppliers
- Exhibit 19: Bargaining power of suppliers – Impact of key factors in 2021 and 2026
- 4.4 Threat of new entrants
- Exhibit 20: Threat of new entrants – Impact of key factors in 2021 and 2026
- 4.5 Threat of substitutes
- Exhibit 21: Threat of substitutes – Impact of key factors in 2021 and 2026
- 4.6 Threat of rivalry
- Exhibit 22: Threat of rivalry – Impact of key factors in 2021 and 2026
- 4.7 Market condition
- Exhibit 23: Chart on Market condition – Five forces 2021 and 2026
5 Market Segmentation by Device
- 5.1 Market segments
- Exhibit 24: Chart on Device – Market share 2021-2026 (%)
- Exhibit 25: Data Table on Device – Market share 2021-2026 (%)
- 5.2 Comparison by Device
- Exhibit 26: Chart on Comparison by Device
- Exhibit 27: Data Table on Comparison by Device
- 5.3 VR and AR devices – Market size and forecast 2021-2026
- Exhibit 28: Chart on VR and AR devices – Market size and forecast 2021-2026 ($ billion)
- Exhibit 29: Data Table on VR and AR devices – Market size and forecast 2021-2026 ($ billion)
- Exhibit 30: Chart on VR and AR devices – Year-over-year growth 2021-2026 (%)
- Exhibit 31: Data Table on VR and AR devices – Year-over-year growth 2021-2026 (%)
- 5.4 Computing devices – Market size and forecast 2021-2026
- Exhibit 32: Chart on Computing devices – Market size and forecast 2021-2026 ($ billion)
- Exhibit 33: Data Table on Computing devices – Market size and forecast 2021-2026 ($ billion)
- Exhibit 34: Chart on Computing devices – Year-over-year growth 2021-2026 (%)
- Exhibit 35: Data Table on Computing devices – Year-over-year growth 2021-2026 (%)
- 5.5 Market opportunity by Device
- Exhibit 36: Market opportunity by Device ($ billion)
6 Customer Landscape
- 6.1 Customer landscape overview
- Exhibit 37: Analysis of price sensitivity, lifecycle, customer purchase basket, adoption rates, and purchase criteria
7 Geographic Landscape
- 7.1 Geographic segmentation
- Exhibit 38: Chart on Market share by geography 2021-2026 (%)
- Exhibit 39: Data Table on Market share by geography 2021-2026 (%)
- 7.2 Geographic comparison
- Exhibit 40: Chart on Geographic comparison
- Exhibit 41: Data Table on Geographic comparison
- 7.3 North America – Market size and forecast 2021-2026
- Exhibit 42: Chart on North America – Market size and forecast 2021-2026 ($ billion)
- Exhibit 43: Data Table on North America – Market size and forecast 2021-2026 ($ billion)
- Exhibit 44: Chart on North America – Year-over-year growth 2021-2026 (%)
- Exhibit 45: Data Table on North America – Year-over-year growth 2021-2026 (%)
- 7.4 Europe – Market size and forecast 2021-2026
- Exhibit 46: Chart on Europe – Market size and forecast 2021-2026 ($ billion)
- Exhibit 47: Data Table on Europe – Market size and forecast 2021-2026 ($ billion)
- Exhibit 48: Chart on Europe – Year-over-year growth 2021-2026 (%)
- Exhibit 49: Data Table on Europe – Year-over-year growth 2021-2026 (%)
- 7.5 APAC – Market size and forecast 2021-2026
- Exhibit 50: Chart on APAC – Market size and forecast 2021-2026 ($ billion)
- Exhibit 51: Data Table on APAC – Market size and forecast 2021-2026 ($ billion)
- Exhibit 52: Chart on APAC – Year-over-year growth 2021-2026 (%)
- Exhibit 53: Data Table on APAC – Year-over-year growth 2021-2026 (%)
- 7.6 South America – Market size and forecast 2021-2026
- Exhibit 54: Chart on South America – Market size and forecast 2021-2026 ($ billion)
- Exhibit 55: Data Table on South America – Market size and forecast 2021-2026 ($ billion)
- Exhibit 56: Chart on South America – Year-over-year growth 2021-2026 (%)
- Exhibit 57: Data Table on South America – Year-over-year growth 2021-2026 (%)
- 7.7 Middle East and Africa – Market size and forecast 2021-2026
- Exhibit 58: Chart on Middle East and Africa – Market size and forecast 2021-2026 ($ billion)
- Exhibit 59: Data Table on Middle East and Africa – Market size and forecast 2021-2026 ($ billion)
- Exhibit 60: Chart on Middle East and Africa – Year-over-year growth 2021-2026 (%)
- Exhibit 61: Data Table on Middle East and Africa – Year-over-year growth 2021-2026 (%)
- 7.8 US – Market size and forecast 2021-2026
- Exhibit 62: Chart on US – Market size and forecast 2021-2026 ($ billion)
- Exhibit 63: Data Table on US – Market size and forecast 2021-2026 ($ billion)
- Exhibit 64: Chart on US – Year-over-year growth 2021-2026 (%)
- Exhibit 65: Data Table on US – Year-over-year growth 2021-2026 (%)
- 7.9 China – Market size and forecast 2021-2026
- Exhibit 66: Chart on China – Market size and forecast 2021-2026 ($ billion)
- Exhibit 67: Data Table on China – Market size and forecast 2021-2026 ($ billion)
- Exhibit 68: Chart on China – Year-over-year growth 2021-2026 (%)
- Exhibit 69: Data Table on China – Year-over-year growth 2021-2026 (%)
- 7.10 Germany – Market size and forecast 2021-2026
- Exhibit 70: Chart on Germany – Market size and forecast 2021-2026 ($ billion)
- Exhibit 71: Data Table on Germany – Market size and forecast 2021-2026 ($ billion)
- Exhibit 72: Chart on Germany – Year-over-year growth 2021-2026 (%)
- Exhibit 73: Data Table on Germany – Year-over-year growth 2021-2026 (%)
- 7.11 UK – Market size and forecast 2021-2026
- Exhibit 74: Chart on UK – Market size and forecast 2021-2026 ($ billion)
- Exhibit 75: Data Table on UK – Market size and forecast 2021-2026 ($ billion)
- Exhibit 76: Chart on UK – Year-over-year growth 2021-2026 (%)
- Exhibit 77: Data Table on UK – Year-over-year growth 2021-2026 (%)
- 7.12 Canada – Market size and forecast 2021-2026
- Exhibit 78: Chart on Canada – Market size and forecast 2021-2026 ($ billion)
- Exhibit 79: Data Table on Canada – Market size and forecast 2021-2026 ($ billion)
- Exhibit 80: Chart on Canada – Year-over-year growth 2021-2026 (%)
- Exhibit 81: Data Table on Canada – Year-over-year growth 2021-2026 (%)
- 7.13 Market opportunity by geography
- Exhibit 82: Market opportunity by geography ($ billion)
8 Drivers, Challenges, and Trends
- 8.1 Market drivers
- 8.2 Market challenges
- 8.3 Impact of drivers and challenges
- Exhibit 83: Impact of drivers and challenges in 2021 and 2026
- 8.4 Market trends
9 Vendor Landscape
- 9.1 Overview
- 9.2 Vendor landscape
- Exhibit 84: Overview on Criticality of inputs and Factors of differentiation
- 9.3 Landscape disruption
- Exhibit 85: Overview on factors of disruption
- 9.4 Industry risks
- Exhibit 86: Impact of key risks on business
10 Vendor Analysis
- 10.1 Vendors covered
- Exhibit 87: Vendors covered
- 10.2 Market positioning of vendors
- Exhibit 88: Matrix on vendor position and classification
- 10.3 Accenture Plc
- Exhibit 89: Accenture Plc – Overview
- Exhibit 90: Accenture Plc – Business segments
- Exhibit 91: Accenture Plc – Key news
- Exhibit 92: Accenture Plc – Key offerings
- Exhibit 93: Accenture Plc – Segment focus
- 10.4 ByteDance Ltd.
- Exhibit 94: ByteDance Ltd. – Overview
- Exhibit 95: ByteDance Ltd. – Product / Service
- Exhibit 96: ByteDance Ltd. – Key offerings
- 10.5 Devden Creative Solutions Pvt. Ltd
- Exhibit 97: Devden Creative Solutions Pvt. Ltd – Overview
- Exhibit 98: Devden Creative Solutions Pvt. Ltd – Product / Service
- Exhibit 99: Devden Creative Solutions Pvt. Ltd – Key offerings
- 10.6 GoMeta Inc.
- Exhibit 100: GoMeta Inc. – Overview
- Exhibit 101: GoMeta Inc. – Product / Service
- Exhibit 102: GoMeta Inc. – Key offerings
- 10.7 Infosys Ltd.
- Exhibit 103: Infosys Ltd. – Overview
- Exhibit 104: Infosys Ltd. – Business segments
- Exhibit 105: Infosys Ltd. – Key news
- Exhibit 106: Infosys Ltd. – Key offerings
- Exhibit 107: Infosys Ltd. – Segment focus
- 10.8 Meta Platforms Inc.
- Exhibit 108: Meta Platforms Inc. – Overview
- Exhibit 109: Meta Platforms Inc. – Business segments
- Exhibit 110: Meta Platforms Inc. – Key news
- Exhibit 111: Meta Platforms Inc. – Key offerings
- Exhibit 112: Meta Platforms Inc. – Segment focus
- 10.9 Microsoft Corp.
- Exhibit 113: Microsoft Corp. – Overview
- Exhibit 114: Microsoft Corp. – Business segments
- Exhibit 115: Microsoft Corp. – Key news
- Exhibit 116: Microsoft Corp. – Key offerings
- Exhibit 117: Microsoft Corp. – Segment focus
- 10.10 NexTech AR Solutions Corp.
- Exhibit 118: NexTech AR Solutions Corp. – Overview
- Exhibit 119: NexTech AR Solutions Corp. – Business segments
- Exhibit 120: NexTech AR Solutions Corp. – Key offerings
- Exhibit 121: NexTech AR Solutions Corp. – Segment focus
- 10.11 NVIDIA Corp.
- Exhibit 122: NVIDIA Corp. – Overview
- Exhibit 123: NVIDIA Corp. – Business segments
- Exhibit 124: NVIDIA Corp. – Key news
- Exhibit 125: NVIDIA Corp. – Key offerings
- Exhibit 126: NVIDIA Corp. – Segment focus
- 10.12 Roblox Corp
- Exhibit 127: Roblox Corp – Overview
- Exhibit 128: Roblox Corp – Product / Service
- Exhibit 129: Roblox Corp – Key offerings
11 Appendix
- 11.1 Scope of the report
- 11.2 Inclusions and exclusions checklist
- Exhibit 130: Inclusions checklist
- Exhibit 131: Exclusions checklist
- 11.3 Currency conversion rates for US$
- Exhibit 132: Currency conversion rates for US$
- 11.4 Research methodology
- Exhibit 133: Research methodology
- Exhibit 134: Validation techniques employed for market sizing
- Exhibit 135: Information sources
- 11.5 List of abbreviations
- Exhibit 136: List of abbreviations
About Us
Technavio is a leading global technology research and advisory company. Their research and analysis focus on emerging market trends and provide actionable insights to help businesses identify market opportunities and develop effective strategies to optimize their market positions. With over 500 specialized analysts, Technavio’s report library consists of more than 17,000 reports and counting, covering 800 technologies, spanning across 50 countries. Their client base consists of enterprises of all sizes, including more than 100 Fortune 500 companies. This growing client base relies on Technavio’s comprehensive coverage, extensive research, and actionable market insights to identify opportunities in existing and potential markets and assess their competitive positions within changing market scenarios.
Contact
Technavio Research
Jesse Maida
Media & Marketing Executive
US: +1 844 364 1100
UK: +44 203 893 3200
Email: media@technavio.com
Website: www.technavio.com/
![]()
![]() View original content to download multimedia:https://www.prnewswire.com/news-releases/metaverse-market-size-to-grow-by-usd-677-98-billion—accenture-plc-and-bytedance-ltd-among-key-vendors–technavio-301544067.html
View original content to download multimedia:https://www.prnewswire.com/news-releases/metaverse-market-size-to-grow-by-usd-677-98-billion—accenture-plc-and-bytedance-ltd-among-key-vendors–technavio-301544067.html
SOURCE Technavio
