Why Does U.S. Customer Satisfaction Keep Falling?
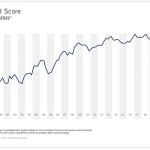
ANN ARBOR, Mich.–(BUSINESS WIRE)–#customersatisfaction–Overall customer satisfaction, tracked by the American Customer Satisfaction Index (ACSI®), fell in the first quarter. It has now dropped in nine of the past 10 quarters and puts ACSI at its lowest level in 15 years (73.6 out of 100).
The collapse in customer satisfaction began in late 2018, well before the COVID-19 pandemic began.
ACSI and GDP growth are related, primarily via consumer spending which accounts for about two-thirds of GDP. For discretionary goods and services, satisfied consumers tend to spend more than dissatisfied consumers.
The decline in customer satisfaction, along with the spread of COVID-19, have led to less consumer spending and negative GDP growth. However, as the pandemic now seems to moderate or contract, GDP increased at an annual rate of 6.4% during the first quarter and, due to a massive pent-up demand, consumer spending grew by a record 10.7% — even as customer satisfaction declined. Low customer satisfaction will not matter much to GDP growth in the short run. In the long term, when the pent-up demand has run its course, it would be problematic if customer satisfaction continues to plummet.
So, what’s behind deteriorating customer satisfaction? Let’s look at the usual reasons: inflation, unrealistic consumer expectations, and market concentration.
Customer satisfaction may weaken if prices go up, if consumer expectations rise, or if business becomes more concentrated and monopolistic. Few, if any, of these factors are behind the current decrease in customer satisfaction, however.
Inflation has not been an issue for a long time. Rising customer expectations, also tracked by ACSI, are not the cause either. While it is true that expectations are higher than the subsequent satisfaction for most buyers, the gap between consumer expectations and satisfaction has remained relatively constant over time.
There is, however, evidence of increasing market concentration, notably in the high-tech sector, but there is no indication that it has had a negative effect on customer satisfaction. For example, two of the largest companies, Apple and Amazon, have had consistently high ACSI scores. They have also been financially well rewarded for it.
The same is true for most companies with high ACSI scores. Over the past 15 years, a stock portfolio of the top-scoring 25-30 ACSI-tracked companies (in their respective industries each year) had a return almost five times greater than the S&P 500: 1,410% vs 293%.
So, what then can explain the decline in overall customer satisfaction? It is not that companies don’t care about the satisfaction of their customers. Businesses today devote more resources than ever to obtaining data about their customers. Paradoxically, however, that may perhaps be the problem.
“Consumer data are noisy and need filtration. Yet, methods for separating signals from noise are rarely used. The same is true about techniques that separate the spurious from the causal,” said Claes Fornell, founder of the ACSI and the Distinguished Donald C. Cook Professor (emeritus) of Business Administration at the University of Michigan. “The most frequently used methods for analyzing the data seem to be descriptive statistics, simple regressions, and methods based on artificial intelligence (AI) and machine learning. None of these are well equipped for establishing cause and effect or for eliminating data noise.”
Fornell is the number one scholar in the world on customer satisfaction, according to Google Scholar Citations.
To understand the relevant issues of consumer demand and be able to improve customer satisfaction, business should upgrade their analytics tools in order to turn data into information. Absent other explanations for the decline in overall U.S. customer satisfaction, upgrading data analytics would probably be an effective remedy.
“ACSI has been successful not only in developing methods for pinpointing how to increase a company’s customer satisfaction, but also in calibrating the customer satisfaction index to maximize its effect on customer retention and reservation prices. There have been many articles in scientific journals showing a positive effect from ACSI on stock returns, earnings, revenue, and cash flows, and a negative effect on direct cost, risk, and cost of capital,” Fornell explained.
The national ACSI score (or ACSI composite) is updated each quarter based on annualized customer satisfaction scores for all sectors and industries. For more, follow the American Customer Satisfaction Index on LinkedIn and Twitter at @theACSI or visit www.theacsi.org.
No advertising or other promotional use can be made of the data and information in this release without the express prior written consent of ACSI LLC.
About the ACSI
The American Customer Satisfaction Index (ACSI®) has been a national economic indicator for 25 years. It measures and analyzes customer satisfaction with more than 400 companies in 47 industries and 10 economic sectors, including various services of federal and local government agencies. Reported on a scale of 0 to 100, scores are based on data from interviews with roughly 500,000 customers annually. For more information, visit www.theacsi.org.
ACSI and its logo are Registered Marks of the University of Michigan, licensed worldwide exclusively to American Customer Satisfaction Index LLC with the right to sublicense.
Contacts
Denise DiMeglio 610-228-2102
denise@gregoryfca.com

