Live TV Streaming Service Delivers Double Digit Revenue, Subscription and Viewership Growth Year-Over-Year
NEW YORK–(BUSINESS WIRE)–fuboTV Inc. (OTCQB: FUBO), previously FaceBank Group, Inc., today has filed Form 8K to include the unaudited financial results of the combined company for the second quarter ended June 30, 2020. These are the first quarterly results reported since FaceBank’s merger with fuboTV Inc. which was completed in April 2020.
Second Quarter Financial Highlights
(Note: The company states its key metrics on a year-over-year basis, given the seasonality of sports content. As the legacy FaceBank business reported no revenue in the second quarter of 2019 and 2020, the comparisons to prior year shown in this document refer to the pro forma 2019 results of the consolidated legacy fuboTV and FaceBank business, unless otherwise stated).
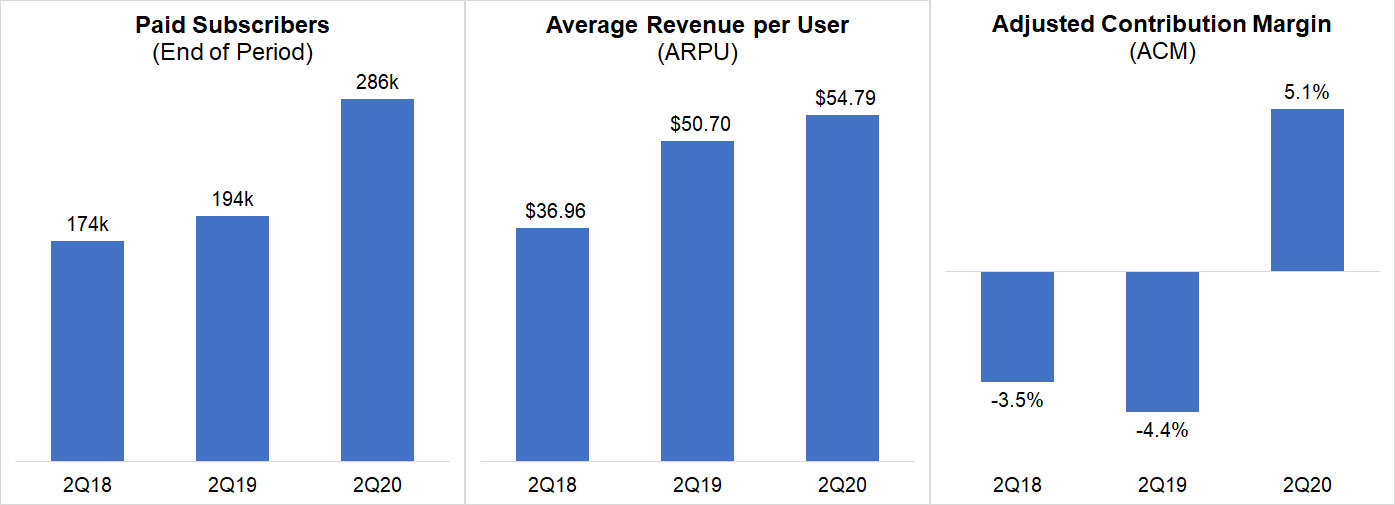
“We delivered strong second quarter results – revenues grew 53% year-over-year, fuboTV paid subscribers increased 47% and content hours streamed increased 83% year-over-year,” said David Gandler, co-founder and CEO, fuboTV. “Consumer engagement continued to be strong in Q2, despite a shutdown of most major league sports both in the U.S. and internationally, and we successfully ramped up advertising revenue.”
“We believe consumers will continue to choose streaming over traditional pay television, especially in the current economic climate because of its more personalized, premium viewing experience. Macro trends towards streaming, combined with our strong second quarter results and continued momentum, reinforce our confidence in our business and the vMVPD space. Looking ahead to Q3, with the gradual return of sports, we anticipate an increase in subscribers, viewership and that our portion of revenue derived from advertising will grow. At the close of Q3 we expect paid subscribers to reach 340,000 – 350,000, which will be an increase of 20% year-over-year. The growth of streaming is one of the most significant changes to television, and television advertising, in the last several decades. fuboTV is at the forefront of the streaming revolution and we are excited for existing and new investors to join us on this journey,” added Gandler.
In a letter released to shareholders today, Gandler described in greater detail the results of the recently completed second quarter and the business. The complete shareholder letter is below.
FUBOTV CEO David Gandler’s Letter to Shareholders
August 13, 2020
Fellow Shareholders,
Q2 was extremely productive for the combined fuboTV/FaceBank business and I’m pleased to share our Q2 2020 unaudited financial results and recent business updates with you today. As highlighted in my previous Shareholder Letters, we completed the merger of fuboTV and FaceBank Group, Inc. in April 2020. The company has changed its legal name to fuboTV Inc. and has applied to FINRA to process this name change on the OTC Markets. We encourage you to read our full set of financial statements and SEC filings, and to sign up for email alerts, on the investor relations section of our website at ir.fubo.tv.
fuboTV currently trades on the OTC market under the symbol “FUBO.” fuboTV is also working to list on a national securities exchange.
As is customary with mergers, we have a large number of SEC filings. We have made significant progress and are focusing our comments today on the go-forward strategy and business of the company, which is fuboTV.
The growth of streaming is one of the most significant changes to television, and television advertising, in the last several decades.
We continue to believe fuboTV is at the forefront of the streaming revolution. fuboTV is the leading sports-first, live TV streaming platform, offering subscribers access to tens of thousands of live sporting events annually as well as leading news and entertainment content. At the core of our offering is our proprietary technology platform optimized for live TV and sports viewership. Our proprietary technology stack has enabled us to regularly offer new features and functionality. For example, we were the first vMVPD to stream in 4K resolution. We also offer multi-view on Apple TV, which enables subscribers to watch two live streams simultaneously, as well as the ability to watch select sports content from multiple camera angles.
We believe consumers will, particularly in this current economic climate, continue to choose streaming over traditional pay television because of this more personalized, premium viewing experience that is also less expensive.
Consumer engagement continued to be strong in Q2, despite a shutdown of most major league sports both in the U.S. and internationally. News and entertainment viewership grew as subscribers looked to stay informed and entertained during the ongoing COVID-19 pandemic, with live sports returning toward the end of the quarter. As previously announced, viewing hours on fuboTV peaked at 8.5 hours/day while consumers were sheltering at home. We believe this increased engagement during the pandemic solidifies the consumer appeal of streaming versus more expensive traditional cable television viewing.
The company has been focused on strengthening its balance sheet. As previously announced, we added $46 million in equity funding from institutional and private investors, including Credit Suisse Capital, LLC.
Q2 2020 Financial and Recent Operating Highlights
Our key metrics should be considered on a year-over-year basis given the seasonality of sports content. Sports content has historically contributed to higher subscription revenue and subscriber additions in the third and fourth quarters, and slower growth in the first and second quarters. For example, in 2018 and 2019, our third and fourth quarters combined represented 60% and 65% of our total gross paid subscriber additions, respectively. To take advantage of the higher levels of purchase intent in the second half of the year, we have historically incurred the majority of our sales and marketing expenses in these periods. While we are working on multiple initiatives that leverage FaceBank’s IP, technology and assets, we expect the monetization of these assets will require a few more quarters. Please note that, as the legacy FaceBank business reported no revenue in the second quarter of 2019 and of 2020, the comparisons to prior year shown below refer to the pro forma 2019 results.
Since April, we’ve added $46 million in equity funding from institutional and private investors. This includes $26 million closed during the second quarter of the year, and a transaction with Credit Suisse Capital to invest $20 million at a purchase price of $9.25 per share that we closed on July 2 and will therefore be reflected in our Q3 financials.
Recent Business Highlights
Guidance
Looking ahead, we are focused on driving both top-line growth and making progress on our path to profitability. Our financial model is driven by strong unit economics, and we expect margin improvement to continue over time, aided by a number of initiatives, including the growth of advertising on our platform along with strong attachment rates on value-added services, including cloud DVR storage and the ability to view multiple streams. We expect the recent addition of the Disney Media Networks to our programming portfolio to help grow our subscription and advertising revenue. Furthermore, we believe fuboTV’s differentiation in the marketplace – sports-focused programming and a tech-first user experience – firmly positions the company strongly for growth.
Our strong second quarter, including continued growth and improved profitability, reinforces our confidence in our business and the vMVPD space. With the return of sports, we anticipate an increase in revenue – both subscriptions and advertising – and viewership during Q3. We believe this also sets up a unique interactive wagering opportunity for the company. Furthermore, we believe the addition of Disney Media Networks, including ESPN, ABC and Disney Channel, alongside our current channel lineup will make fuboTV even more appealing to the entire household and in particular sports fans. With Disney, fuboTV is expected to have the most complete NFL game coverage of any vMVPD.
At the close of the third quarter, we anticipate strong paid subscriber growth and expect to have reached 340,000-350,000 total subscriptions, representing growth of over 20% year-over-year. While the advertising market is unsure given the pandemic, we expect that advertising will become a more meaningful part of our business moving forward, and a greater percentage of our overall revenue mix.
It is important to note that there continues to be uncertainty around the return of live sports, specifically college football and the NFL due to the ongoing pandemic. We have factored in ongoing uncertainty around the fall sports calendar in our subscriber guidance.
Summary
The strength of the streaming business during the pandemic is a clear sign that vMVPDs have a bright future. fuboTV’s solid second quarter validated our belief that consumers are seeking lower cost alternatives to traditional television. Our streaming hours grew over the prior year despite a near total shutdown of sports. This is primarily a result of fuboTV’s expanded programming offering for the entire family combined with product innovations that deliver a premium viewing experience not available through traditional television. We expect streaming hours to grow as sports return. And, with the recent (August) addition of Disney Media Networks, including ESPN, to our offering, fuboTV has a market-leading 43 of the top 50 Nielsen-ranked sports, news and entertainment networks as well as significant coverage of soccer, NFL, NBA, NHL, MLB and college sports.
We continue to be very excited about fuboTV’s future and the strength of our company. We believe fuboTV is at the forefront of the streaming revolution in the $226 billion pay TV services market and are excited for existing and new investors to join us on this journey.
Sincerely,
David Gandler, co-founder and CEO
More Information
Additional information is available at www.sec.gov under fuboTV Inc.’s filings, as well as https://ir.fubo.tv and https://ir.facebankgroup.com/.
fuboTV intends to use its website as a disclosure channel and investors are encouraged to refer to it, as well as press releases and SEC filings. The company encourages reading the full set of financial statements, including, pro forma financial statements for the combined company, and related disclosures, as filed in its Form 10-Q for the quarter ended June 30, 2020 to be filed this week.
About fuboTV
fuboTV (OTCQB: FUBO) is the leading sports-first live TV streaming platform offering subscribers access to tens of thousands of live sporting events annually as well as leading news and entertainment content. fuboTV’s base package, fubo Standard, features a broad mix of 100+ channels, including 43 of the top 50 Nielsen-ranked networks across sports, news and entertainment (Primetime A18-49).
Continually innovating to give subscribers a premium viewing experience they can’t find with cable TV, fuboTV is regularly first-to-market with new product features and was the first virtual MVPD to stream in 4K.
fuboTV merged with FaceBank Group in April 2020 to create a leading digital entertainment company, combining fuboTV’s direct-to-consumer live TV streaming platform for cord-cutters with FaceBank’s technology-driven IP in sports, movies and live performances.
Forward-Looking Statements
This letter contains forward-looking statements of fuboTV Inc. (“fuboTV”) that involve substantial risks and uncertainties. All statements contained in this press release are forward-looking statements within the meaning of The Private Securities Litigation Reform Act of 1995. The words “could,” “will,” “plan,” “intend,” “anticipate,” “approximate,” “expect,” “potential,” or the negative of these terms or other similar expressions are intended to identify forward-looking statements, although not all forward-looking statements contain these identifying words. Actual results or events could differ materially from the plans, intentions and expectations disclosed in the forward-looking statements that fuboTV makes due to a number of important factors, including (i) risks related to the ability to realize the anticipated benefits of the merger, (ii) risks related to the combined entity’s access to capital and fundraising prospects to fund its ongoing operations and its ability to continue as a “going concern”, (iii) risks related to the combined entity’s ability to uplist to a national securities exchange, (iv) risks related to diverting management’s attention from fuboTV’s ongoing business operations to address integration and fundraising efforts, and (v) other business effects, including the effects of industry, market, economic, political or regulatory conditions, future exchange and interest rates, and changes in tax and other laws, regulations, rates and policies, including the impact of COVID-19 on the broader market. Further risks that could cause actual results to differ materially from those matters expressed in or implied by such forward-looking statements are discussed in the company’s periodic filings with the Securities and Exchange Commission and we encourage you to read such risks in detail. The forward-looking statements in this press release represent fuboTV’s views as of the date of this press release. fuboTV anticipates that subsequent events and developments will cause its views to change. However, while it may elect to update these forward-looking statements at some point in the future, it specifically disclaims any obligation to do so. You should, therefore, not rely on these forward-looking statements as representing fuboTV’s views as of any date subsequent to the date of this letter.
(fuboTV Inc. Financial Statements begin on the following pages)
|
fuboTV Inc. Condensed Consolidated Statements of Operations and Comprehensive Loss (Unaudited) (in thousands, except share and per share amounts) |
||||||||||||||||
|
|
|
Three Months Ended June 30, |
|
|
Six Months Ended June 30, |
|
||||||||||
|
|
|
2020 |
|
|
2019 |
|
|
2020 |
|
|
2019 |
|
||||
|
Revenues, net |
|
|
|
|
|
|
|
|
|
|
|
|
|
|
|
|
|
Subscriptions |
|
$ |
39,511 |
|
|
$ |
— |
|
|
$ |
39,511 |
|
|
$ |
— |
|
|
Advertisements |
|
|
4,323 |
|
|
|
— |
|
|
|
4,323 |
|
|
— |
|
|
|
Software licenses, net |
|
|
— |
|
|
|
— |
|
|
|
7,295 |
|
|
— |
|
|
|
Other |
|
|
338 |
|
|
|
— |
|
|
|
338 |
|
|
|
— |
|
|
|
|
|
|
|
|
|
|
|
|
|
|
|
|
|
|
|
|
Total Revenues |
|
$ |
44,172 |
|
|
$ |
— |
|
|
$ |
51,467 |
|
|
$ |
— |
|
|
|
|
|
|
|
|
|
|
|
|
|
|
|
|
|
|
|
|
Operating expenses: |
|
|
|
|
|
|
|
|
|
|
|
|
|
|
|
|
|
Subscriber related expenses |
|
|
53,087 |
|
|
|
— |
|
|
|
53,087 |
|
|
|
— |
|
|
Broadcasting and transmission |
|
|
9,492 |
|
|
|
— |
|
|
|
9,492 |
|
|
|
— |
|
|
Sales and marketing |
|
|
7,577 |
|
|
|
111 |
|
|
|
11,256 |
|
|
|
324 |
|
|
Technology and development |
|
|
9,551 |
|
|
|
— |
|
|
|
9,551 |
|
|
|
— |
|
|
General and administrative |
|
|
17,338 |
|
|
|
693 |
|
|
|
33,862 |
|
|
|
1,517 |
|
|
Depreciation and amortization |
|
|
14,417 |
|
|
|
5,158 |
|
|
|
19,637 |
|
|
|
10,316 |
|
|
|
|
|
|
|
|
|
|
|
|
|
|
|
|
|
|
|
|
Total operating expenses |
|
|
111,462 |
|
|
|
5,962 |
|
|
|
136,885 |
|
|
|
12,157 |
|
|
|
|
|
|
|
|
|
|
|
|
|
|
|
|
|
|
|
|
Operating loss |
|
|
(67,290 |
) |
|
|
(5,962 |
) |
|
|
(85,418 |
) |
|
|
(12,157 |
) |
|
|
|
|
|
|
|
|
|
|
|
|
|
|
|
|
|
|
|
Other income (expense): |
|
|
|
|
|
|
|
|
|
|
|
|
|
|
|
|
|
Interest expense and financing costs |
|
|
(13,325 |
) |
|
|
(454 |
) |
|
|
(15,906 |
) |
|
|
(900 |
) |
|
Loss on deconsolidation of Nexway |
|
|
— |
|
|
|
— |
|
|
|
(11,919 |
) |
|
|
— |
|
|
Loss on issuance of notes, bonds and warrants |
|
|
(26,753 |
) |
|
|
— |
|
|
|
(50,806 |
) |
|
|
— |
|
|
Change in fair value of warrant liabilities |
|
|
4,966 |
|
|
|
— |
|
|
|
4,600 |
|
|
|
— |
|
|
Change in fair value of subsidiary warranty liability |
|
|
18 |
|
|
|
1,124 |
|
|
|
3 |
|
|
|
3,601 |
|
|
Change in fair value of shares settled liability |
|
|
(1,485 |
) |
|
|
— |
|
|
|
(1,665 |
) |
|
|
— |
|
|
Change in fair value of derivative liabilities |
|
|
(823 |
) |
|
|
890 |
|
|
|
(526 |
) |
|
|
1,018 |
|
|
Change in fair value of profit share liability |
|
|
(148 |
) |
|
|
— |
|
|
|
(148 |
) |
|
|
— |
|
|
Unrealized gain on equity method investment |
|
|
2,614 |
|
|
|
— |
|
|
|
2,614 |
|
|
|
— |
|
|
Other expense |
|
|
(1,010 |
) |
|
|
— |
|
|
|
(1,446 |
) |
|
|
— |
|
|
|
|
|
|
|
|
|
|
|
|
|
|
|
|
|
|
|
|
Total other (expense) income |
|
|
(35,946 |
) |
|
|
1,560 |
|
|
|
(75,199 |
) |
|
|
3,719 |
|
|
|
|
|
|
|
|
|
|
|
|
|
|
|
|
|
|
|
|
Loss before income taxes |
|
|
(103,236 |
) |
|
|
(4,402 |
) |
|
|
(160,617 |
) |
|
|
(8,438 |
) |
|
Income tax benefit |
|
|
3,481 |
|
|
|
1,037 |
|
|
|
4,519 |
|
|
|
2,206 |
|
|
|
|
|
|
|
|
|
|
|
|
|
|
|
|
|
|
|
|
Net loss |
|
$ |
(99,755 |
) |
|
$ |
(3,365 |
) |
|
$ |
(156,098 |
) |
|
$ |
(6,232 |
) |
|
Less: net (loss) income attributable to non-controlling interest |
|
|
(682 |
) |
|
|
2,182 |
|
|
|
(1,555 |
) |
|
|
2,781 |
|
|
|
|
|
|
|
|
|
|
|
|
|
|
|
|
|
|
|
|
Net loss attributable to controlling interest |
|
$ |
(99,073 |
) |
|
$ |
(5,547 |
) |
|
$ |
(154,543 |
) |
|
$ |
(9,013 |
) |
|
|
|
|
|
|
|
|
|
|
|
|
|
|
|
|
|
|
|
Less: Deemed divided – beneficial conversion feature on preferred stock |
|
|
— |
|
|
|
— |
|
|
|
171 |
|
|
— |
|
|
|
|
|
|
|
|
|
|
|
|
|
|
|
|
|
|
|
|
|
Net loss attributable to common stockholders |
|
$ |
(99,073 |
) |
|
$ |
(5,547 |
) |
|
$ |
(154,714 |
) |
|
$ |
(9,013 |
) |
|
|
|
|
|
|
|
|
|
|
|
|
|
|
|
|
|
|
|
Net loss per share attributable to common stockholders: |
|
|
|
|
|
|
|
|
|
|
|
|
|
|
|
|
|
Basic and diluted |
|
$ |
(2.82 |
) |
|
$ |
(0.24 |
) |
|
$ |
(4.77 |
) |
|
$ |
(0.50 |
) |
|
|
|
|
|
|
|
|
|
|
|
|
|
|
|
|
|
|
|
Weighted average shares outstanding: |
|
|
|
|
|
|
|
|
|
|
|
|
|
|
|
|
|
Basic and diluted |
35,045,390 |
22,964,199 |
32,390,829 |
17,952,188 |
||||||||||||
|
fuboTV Inc.
Condensed Consolidated Balance Sheets (in thousands, except for share and per share information) |
|||||||||||||
|
|
|
June 30, 2020 |
|
|
December 31, 2019 |
|
|
||||||
|
|
|
(unaudited) |
|
|
* |
|
|
||||||
|
ASSETS |
|
|
|
|
|
|
|
|
|
||||
|
Current assets: |
|
|
|
|
|
|
|
|
|
||||
|
Cash and cash equivalents |
|
$ |
|
|
7,356 |
|
$ |
7,624 |
|
||||
|
Accounts receivable, net |
|
|
4,112 |
|
|
|
8,904 |
|
|
||||
|
Prepaid expenses and other current assets |
|
|
2,839 |
|
|
|
1,445 |
|
|
||||
|
Assets held for sale (Note 7) |
|
|
35,494 |
|
|
|
— |
|
|
||||
|
Total current assets |
|
|
49,801 |
|
|
|
17,973 |
|
|
||||
|
Property and equipment, net |
|
|
|
|
1,933 |
|
|
335 |
|
||||
|
Restricted cash |
|
|
1,330 |
|
|
|
— |
|
|
||||
|
Financial assets at fair value |
|
|
— |
|
|
|
1,965 |
|
|
||||
|
Intangible assets, net |
|
|
340,785 |
|
|
|
116,646 |
|
|
||||
|
Goodwill |
|
|
710,962 |
|
|
|
227,763 |
|
|
||||
|
Operating leases – right-of-use assets |
|
|
5,152 |
|
|
|
3,519 |
|
|
||||
|
Other non-current assets |
|
|
403 |
|
|
|
24 |
|
|
||||
|
|
|
|
|
|
|
|
|
|
|
||||
|
Total assets |
|
$ |
1,110,366 |
|
|
$ |
368,225 |
|
|
||||
|
|
|
|
|
|
|
|
|
|
|
||||
|
Liabilities, convertible preferred stock and stockholders’ equity |
|
|
|
|
|
|
|
|
|
||||
|
Current liabilities: |
|
|
|
|
|
|
|
|
|
||||
|
Accounts payable, accrued expenses and other current liabilities |
|
$ |
109,404 |
|
|
$ |
56,775 |
|
|
||||
|
Accounts payable – due to related parties |
|
|
17,010 |
|
|
|
665 |
|
|
||||
|
Accrued expenses – due to related parties |
|
|
43,170 |
|
|
|
— |
|
|
||||
|
Notes payable, net of discount |
|
|
16,542 |
|
|
|
4,090 |
|
|
||||
|
Note payable – related parties |
|
|
539 |
|
|
|
368 |
|
|
||||
|
Convertible notes, net of $2,027 and $710 discount as of June 30, 2020 and December 31, 2019, respectively |
|
|
4,407 |
|
|
|
1,358 |
|
|
||||
|
Shares settled liability for intangible asset |
|
|
— |
|
|
|
1,000 |
|
|
||||
|
Deferred revenue |
|
|
8,855 |
|
|
|
— |
|
|
||||
|
Profit share liability |
|
|
2,119 |
|
|
|
1,971 |
|
|
||||
|
Warrant liability – subsidiary |
|
|
21 |
|
|
|
24 |
|
|
||||
|
Warrant liabilities |
|
|
40,617 |
|
|
|
— |
|
|
||||
|
Derivative liabilities |
|
|
163 |
|
|
|
376 |
|
|
||||
|
Long term borrowings – current portion |
|
|
8,154 |
|
|
|
— |
|
|
||||
|
Current portion of operating lease liabilities |
|
|
970 |
|
|
|
815 |
|
|
||||
|
Liabilities held for sale (Note 7) |
|
|
56,137 |
|
|
|
— |
|
|
||||
|
|
|
|
|
|
|
|
|
|
|
||||
|
Total current liabilities |
|
|
308,108 |
|
|
|
67,442 |
|
|
||||
|
|
|
|
|
|
|
|
|
|
|
||||
|
Deferred income taxes |
|
|
90,794 |
|
|
|
30,879 |
|
|
||||
|
Operating lease liability |
|
|
4,189 |
|
|
|
2,705 |
|
|
||||
|
Long term borrowings |
|
|
19,197 |
|
|
|
43,982 |
|
|
||||
|
Other long-term liabilities |
|
|
1 |
|
|
|
41 |
|
|
||||
|
|
|
|
|
|
|
|
|
|
|
||||
|
Total liabilities |
|
|
422,289 |
|
|
|
145,049 |
|
|
||||
|
|
|
|
|
|
|
|
|
|
|
||||
|
Commitments and contingencies (Note 19) |
|
|
|
|
|
|
|
|
|
||||
|
|
|
|
|
|
|
|
|
|
|
||||
|
Series D Convertible Preferred stock, $0.0001 par value, 2,000,000 shares authorized, 203,000 and 456,000 shares issued and outstanding at June 30, 2020 and December 31, 2019, respectively; aggregate liquidation preference of $208 and $462 as of June 30, 2020 and December 31, 2019, respectively |
|
|
208 |
|
|
|
462 |
|
|
||||
|
|
|
|
|
|
|
|
|
|
|
||||
|
Stockholders’ equity: |
|
|
|
|
|
|
|
|
|
||||
|
Series AA Convertible Preferred stock, par value $0.0001, 35,800,000 shares authorized, 27,412,193 and 0 shares issued and outstanding as of June 30, 2020 and December 31, 2019, respectively |
|
|
566,124 |
|
|
|
— |
|
|
||||
|
Series A Preferred stock, par value $0.0001, 5,000,000 shares authorized, 0 shares issued and outstanding as of June 30, 2020 and December 31, 2019, respectively |
|
|
— |
|
|
|
— |
|
|
||||
|
Series B Convertible Preferred stock, par value $0.0001, 1,000,000 shares authorized, 0 shares issued and outstanding as of June 30, 2020 and December 31, 2019, respectively |
|
|
— |
|
|
|
— |
|
|
||||
|
Series C Convertible Preferred stock, par value $0.0001, 41,000,000 shares authorized, 0 shares issued and outstanding as of June 30, 2020 and December 31, 2019, respectively |
|
|
— |
|
|
|
— |
|
|
||||
|
Series X Convertible Preferred stock, par value $0.0001, 1,000,000 shares authorized, 0 shares issued and outstanding as of June 30, 2020 and December 31, 2019, respectively |
|
|
— |
|
|
|
— |
|
|
||||
|
Common stock par value $0.0001: 400,000,000 shares authorized; 38,684,514 and 28,912,500 shares issued and outstanding at June 30, 2020 and December 31, 2019, respectively |
|
|
4 |
|
|
|
3 |
|
|
||||
|
Additional paid-in capital |
|
|
315,871 |
|
|
|
257,002 |
|
|
||||
|
Accumulated deficit |
|
|
(210,540 |
) |
|
|
(56,123 |
) |
|
||||
|
Non-controlling interest |
|
|
16,410 |
|
|
|
22,602 |
|
|
||||
|
Accumulated other comprehensive loss |
|
|
— |
|
|
|
(770 |
) |
|
||||
|
|
|
|
|
|
|
|
|
|
|
||||
|
Total stockholders’ equity |
|
|
687,869 |
|
|
|
222,714 |
|
|
||||
|
|
|
|
|
|
|
|
|
|
|
||||
|
TOTAL LIABILITIES, CONVERTIBLE PREFERRED STOCK AND STOCKHOLDERS’ EQUITY |
|
$ |
1,110,366 |
|
|
$ |
368,225 |
|
|
||||
Contacts
Investors:
The Blueshirt Group for fuboTV
ir@fubo.tv
Media:
Jennifer L. Press, fuboTV
jpress@fubo.tv
Katie Minogue, fuboTV
kminogue@fubo.tv
Release includes motion dataset, foundation model, and streaming architecture designed to align speech, gesture, and…
VANCOUVER, BC, April 9, 2026 /PRNewswire/ -- MiniTool Software Limited has announced the launch of…
Vancouver, British Columbia--(Newsfile Corp. - April 8, 2026) - ImagineAR Inc. (CSE: IP) (OTCQB: IPNFF)…
The Pilot Episode Follows Tom Gibbs and The 3 Secrets Behind His Rise from Small-Town…
BOLOGNA, Italy, April 8, 2026 /PRNewswire/ -- As the 2026 Bologna Children's Book Fair approaches,…
The 3D Rendering Service Market is growing steadily due to rising demand for high-quality visual…